Readings mapped to your spaces
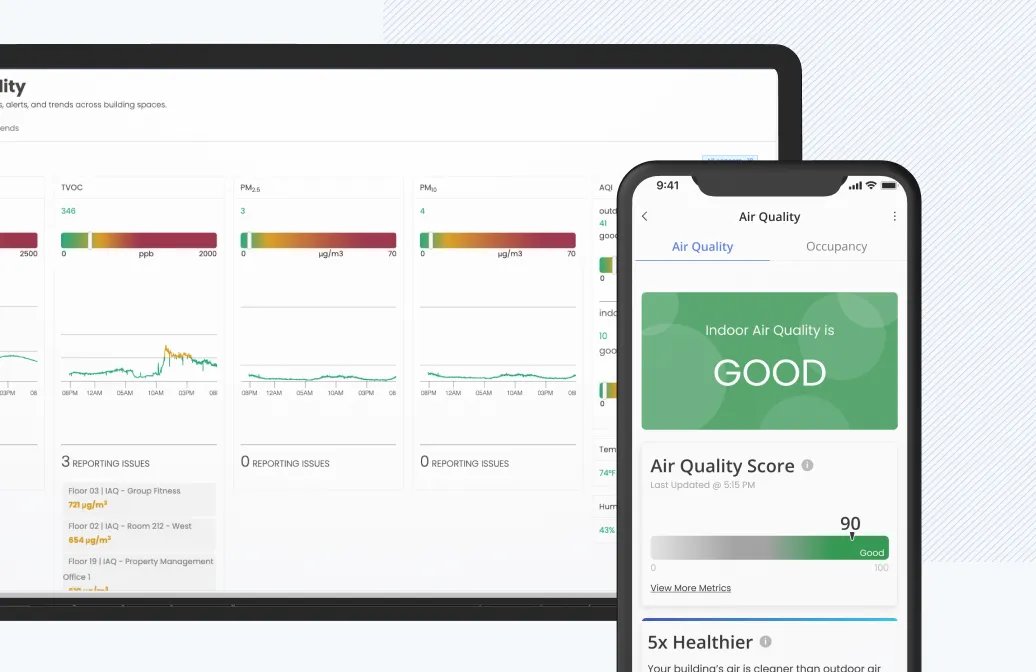
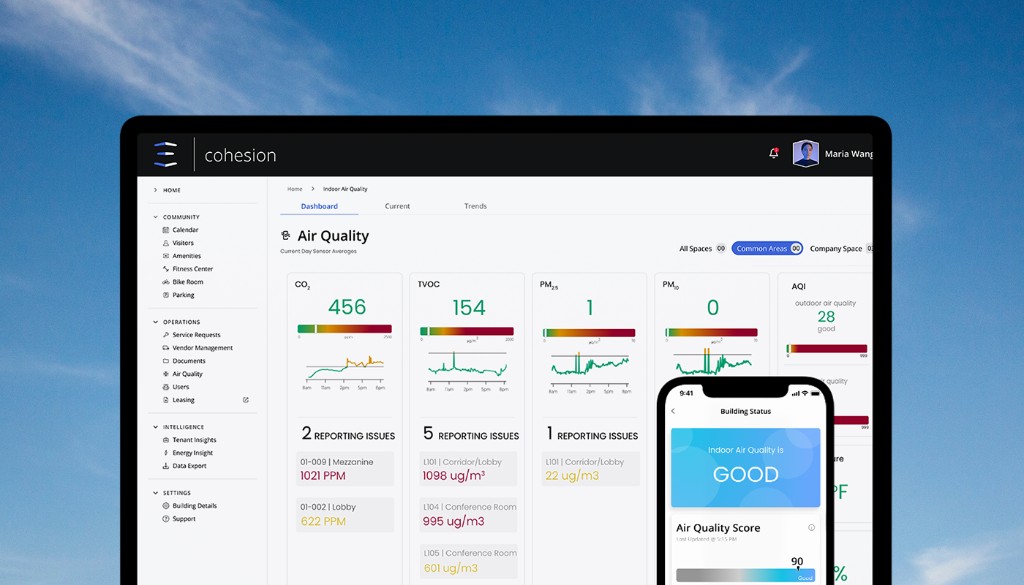
Every CO2, TVOC, PM2.5, and PM10 reading is tied to a specific space, so a flagged reading resolves to a mezzanine, lobby, or conference room instead of a floating number.
Indoor Air Quality
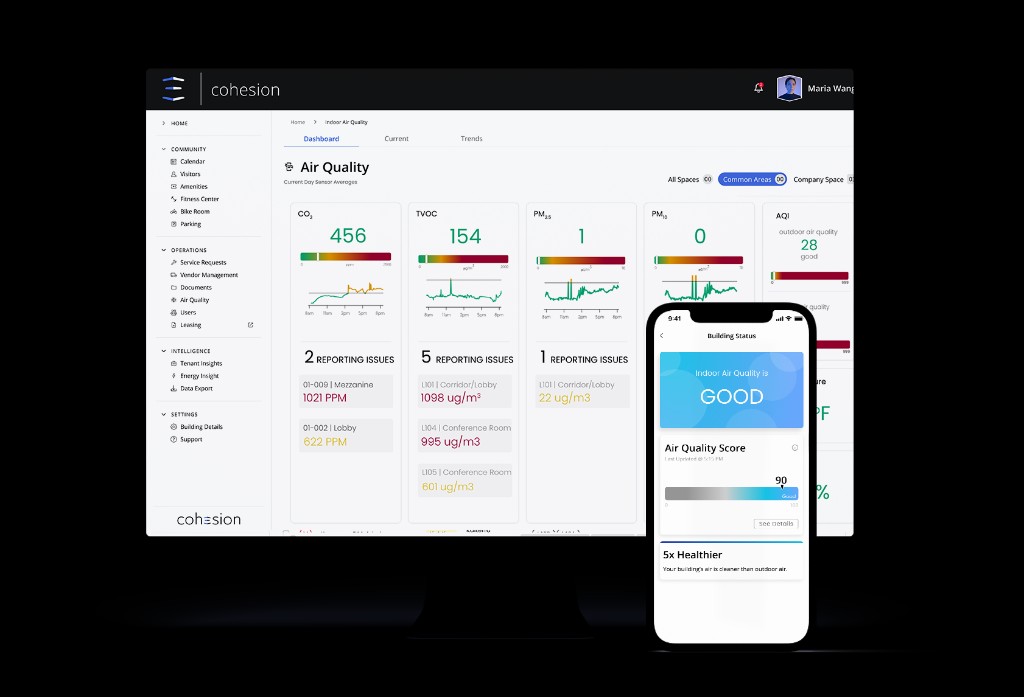
Track CO2, TVOC, PM2.5, and PM10 against ASHRAE thresholds, then raise airflow in the zones that need it. Continuous monitoring and automated optimization, not a one-time test.
Results from a live deployment
pollutant reduction to healthy levels
average IAQ mitigation response time
increased clean air over an 8-hour day
Chicago building, 6-month measurement window
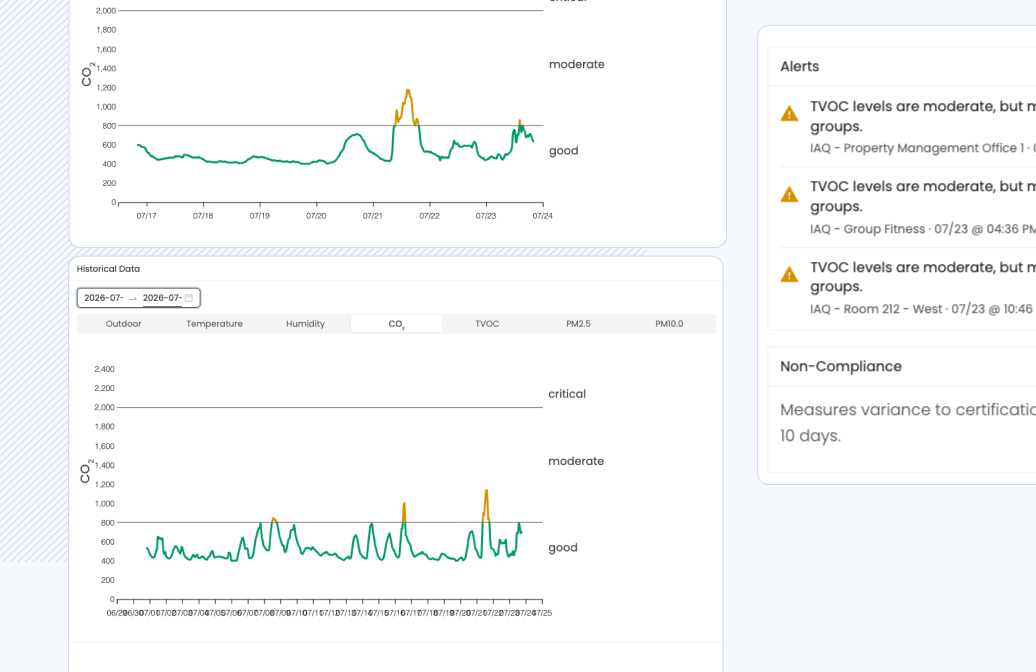
See readings mapped to the spaces that have them, watch live data, and track trend lines over time.
Every CO2, TVOC, PM2.5, and PM10 reading is tied to a specific space, so a flagged reading resolves to a mezzanine, lobby, or conference room instead of a floating number.
When pollutants rise, Cohesion increases airflow where it matters and tells management what changed.
Building conditions adjust automatically: airflow increases in the affected zone in real time based on sensor data, and management is notified of the change.
µg/m³ · 4-hour averages · Jul 13–17
Thursday evening to Friday afternoon: 18 → 2 µg/m³, an 88% reduction, across 202 mitigations while outside held at 30–100.
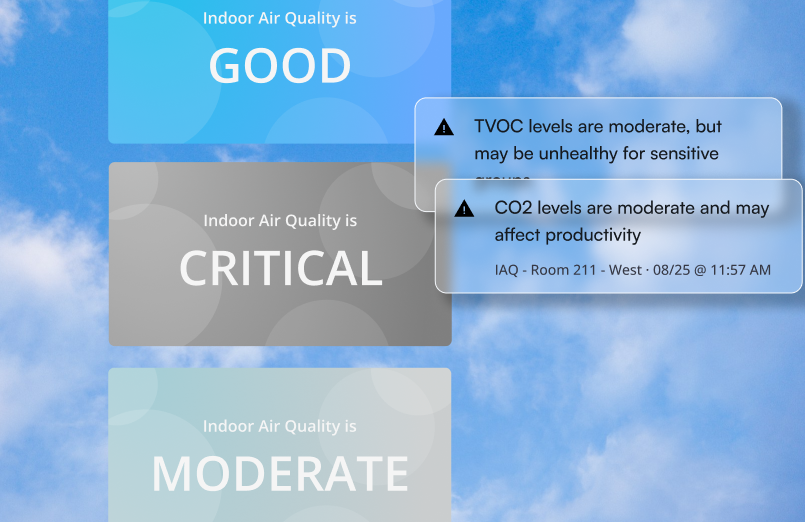
CO2, TVOC, PM2.5, and PM10, with alerts based on ASHRAE guidelines for permissioned operators.
Monitoring shows live readings and alerts. Monitoring + optimization also raises airflow in the affected zone through remote BAS control and notifies management of the change.
You need IAQ sensors for monitoring. Optimization uses those readings plus a connection to the building automation system so airflow can change in the affected zone.
Tenants and staff can see live air quality in the Cohesion app and on the web, including a clear building status when conditions are good.
No. Cohesion targets the affected zone instead of flushing the entire floor or building, which uses less energy than running the system flat out.
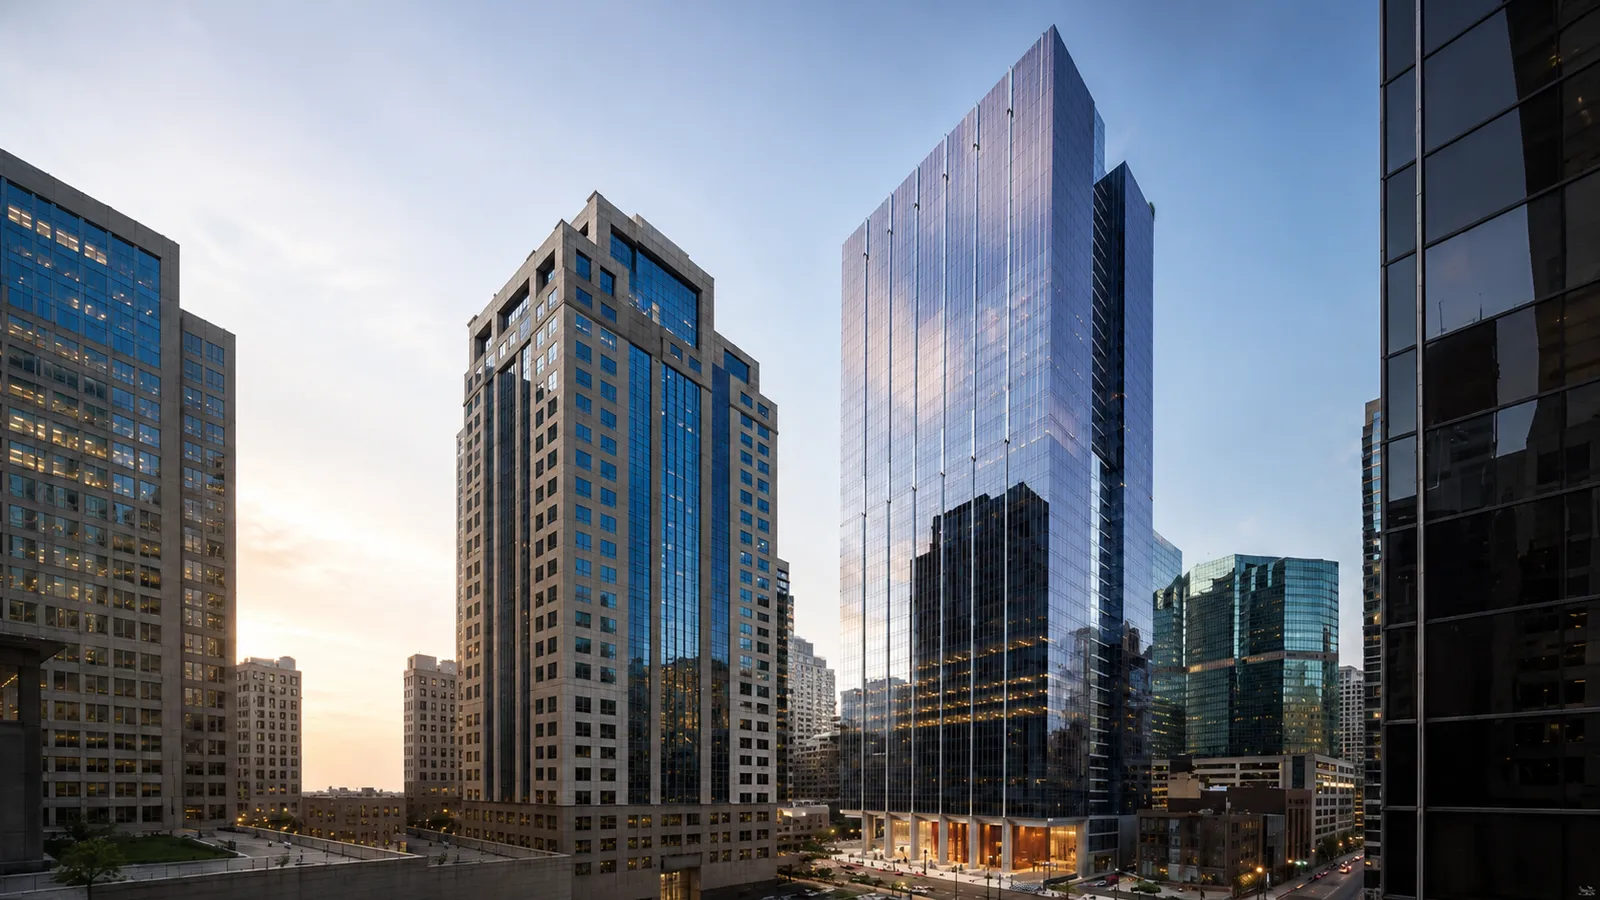
The John Buck Company runs IAQ monitoring and optimization at 151 North Franklin and 155 North Wacker, 1.93 million square feet of Class A office space, on the same platform as access, reservations, and work orders.
Read the case studyChallenge
Two Class A towers needed measurable air quality performance to support JBC's ESG goals, without adding headcount.
Solution
IAQ monitoring and automated optimization running on the same platform as access, reservations, and work orders.
Result
16%
Reduction in pollutant levels through air quality optimization.
We'll map sensor coverage, BAS connections, and the monitoring vs optimization path for your buildings.