
Everstone Financial rightsizes its office with a four-week SpacePulse study
Real occupancy data exposes a room mix built for the wrong meetings
Schedule a CallChallenge
A room mix built on assumptions, not real usage data
Solution
A four-week sensor and reservation study across two floors
Outcome
50% fewer seats, 44% more rooms, sized to real demand
Result
50% fewer seats
A validated room mix that adds 44% more rooms while cutting total seats in half
Company
Everstone Financial
Industry
Workplace
Services
Real Estate Intelligence & Space Planning
Everstone Financial wanted to make space decisions from evidence instead of instinct. Rather than guess at a room mix from a floor plan or a few days of walkthroughs, the team engaged Cohesion's SpacePulse service: a four-week, sensor-driven space-utilization study built on the Savvy platform. The study covered 20+ conference rooms and desk areas across two office floors, monitored from 9 AM to 5 PM every business day.
The Challenge
Everstone Financial needed to know whether its conference room and desk mix actually matched how people met and worked day to day, not assumptions from calendar bookings or a one-time walkthrough. Getting it wrong meant paying for square footage the business didn't use, in rooms sized for meetings that rarely happened.
What We Did
What we measured
SpacePulse blends multiple independent data sources, so no single feed (badge swipes, calendar invites, or A/V sensors alone) has to carry the whole picture:
- Savvy as the system of record for the engagement, unifying every feed into one dataset
- Temporary Butlr heat-based ceiling sensors, capturing occupancy in 15-minute intervals across every observed space
- Logitech A/V Rally Bar data for additional AV-equipped conference rooms
- Nuvolo for room and space labeling
- Outlook reservations, to compare "intent-to-meet" against what actually happened
- Badge swipes, to track total in-office occupancy day over day
What the data revealed
The four-week window, spanning September 22 to October 17, showed an office that was busy (daily badge-in rates consistently ran 80–103%) but a room mix that didn't match how that traffic actually behaved:
- 1-person meetings were the single largest use case. They accounted for 42.68% of all conference room seat-minutes, while meetings of 2–4 people made up another 50% of utilized time. Groups of 8 or more accounted for roughly 2%.
- Large rooms sat empty most of the time. Across the five large conference rooms, 86.6% of their seat-minutes went to groups of just 1–4 people, and large rooms had zero occupants 64% of the time.
- Demand never came close to straining supply. No more than 4 conference rooms were in simultaneous use 76% of the time, and the full inventory of 9 rooms was never required at once during the study.
- Reservations didn't reflect reality. Only 2.6% of room reservations were both booked and used as intended, 30.6% were ad-hoc use with no reservation at all, and 59.3% went completely unused, true "ghost" availability that never showed up on a calendar.
- Small spaces outperformed large ones. As desk-cluster size increased, utilization dropped: small open areas (2–3 desks) hit 71.81% average utilization, well ahead of medium (66.39%) and large (68.89%) open areas, and did it with more than 3x the fullness factor of large open areas.
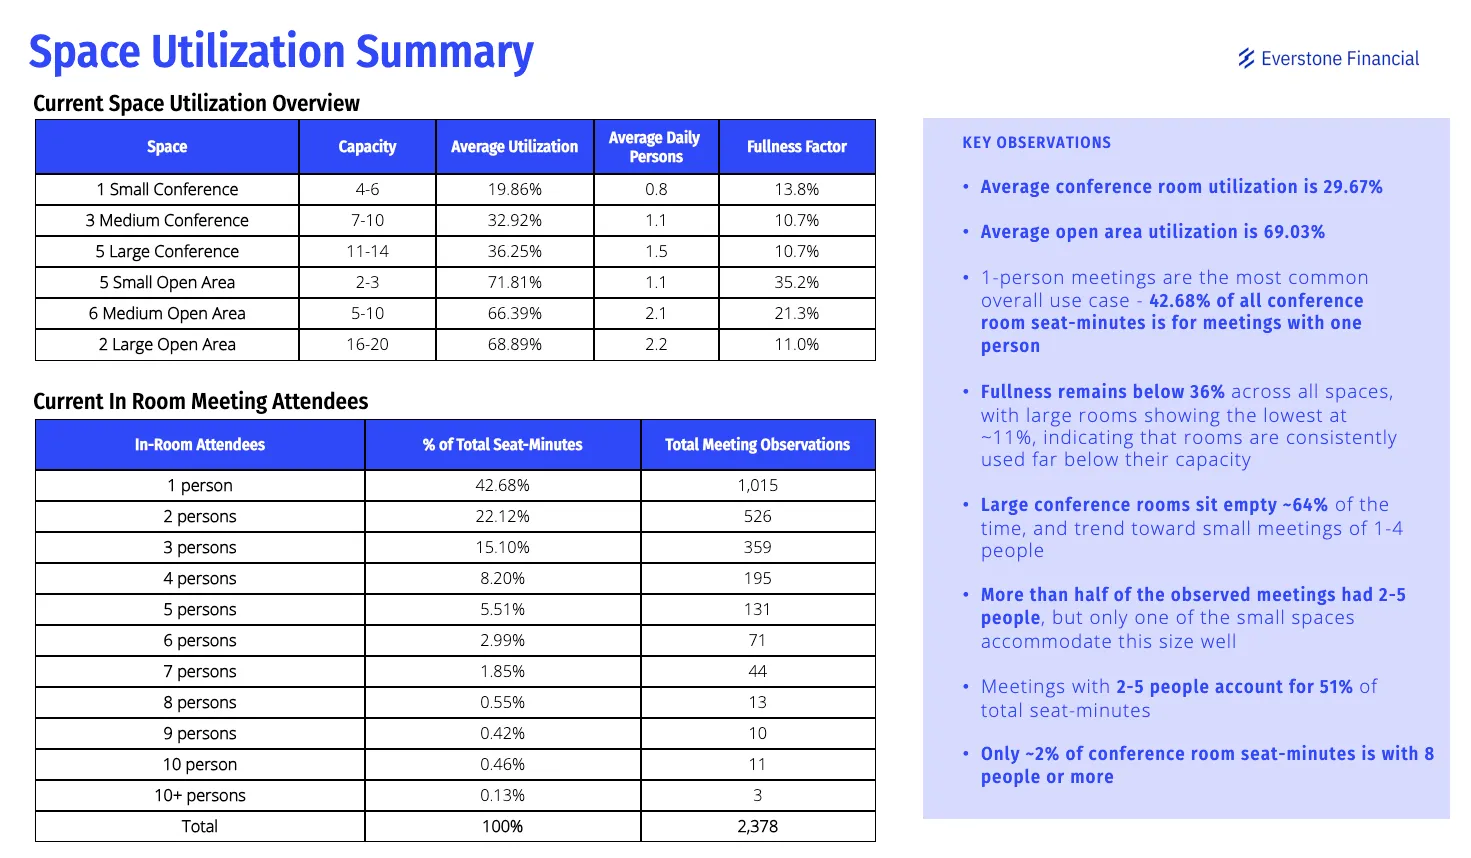
| Space | Capacity | Avg. Utilization | Avg. Daily Persons | Fullness |
|---|---|---|---|---|
| 1 Small Conference | 4–6 | 19.86% | 0.8 | 13.8% |
| 3 Medium Conference | 7–10 | 32.92% | 1.1 | 10.7% |
| 5 Large Conference | 11–14 | 36.25% | 1.5 | 10.7% |
| 5 Small Open Area | 2–3 | 71.81% | 1.1 | 35.2% |
| 6 Medium Open Area | 5–10 | 66.39% | 2.1 | 21.3% |
| 2 Large Open Area | 16–20 | 68.89% | 2.2 | 11.0% |
Right-sizing the room mix
Using observed peak demand, SpacePulse modeled coverage ratios for a revised room mix and validated it against the busiest 15-minute intervals of the study, not averages. The resulting plan reallocates capacity toward the sizes people actually use:
| Space | Current seats | Current rooms | Suggested seats | Suggested rooms |
|---|---|---|---|---|
| Phone rooms | 0 | 0 | 7 | 7 |
| Small conference | 6 | 1 | 24 | 4 |
| Medium conference | 30 | 3 | 8 | 1 |
| Large conference | 70 | 5 | 14 | 1 |
| Total | 106 | 9 | 53 | 13 |
Recommendations delivered to the team:
- Convert 2–3 underutilized large rooms into 4–6 small rooms. The two lowest-performing large rooms were booked and used as intended just 0.93% and 0.68% of the time, with over half their seat-minutes going to solo meetings, prime candidates for conversion into huddle space.
- Retain one large room for legitimate big meetings. The only 16-person room was the sole space that ever hosted 10+ person meetings, validating the need to keep some large-format capacity for trainings and client presentations.
- Add phone booths. 1-person meetings were the top use case at every room size, including 74% of bookings in the office's one small conference room, effectively running it as a phone room already.
- Expand the best-performing small desk clusters. Small open areas were already near capacity on Tuesdays; adding 1–2 desks captures headroom without adding square footage.
- Favor 2–3 desk clusters over large open floors in future layouts. Utilization fell as cluster size grew, the opposite of the mix Everstone had built.
The Outcome
The study replaced assumptions with a data-backed floor plan: a 50% reduction in total seats paired with 44% more rooms, shifting capacity from a handful of oversized conference rooms to the small rooms, huddle spaces, and phone booths that match how the office actually meets. Because the underlying data lives in Savvy, Everstone Financial can revisit the model as the space is rebuilt or as usage patterns shift, rather than re-running a manual study from scratch.