


Most leaders want clear insight. They want fast answers. They want to know how people use space, how systems perform, and how to guide spend. They expect the data to feel simple. It does not feel simple today.
The core issue sits in the data itself. Each insight needs the right source. Each source speaks a different language. Each source uses a different structure. The work to align it all takes time, and too often engineering skills. Many companies hire one data analyst and assume the job ends there. That analyst knows how to query data. They do not know how to calculate dwell time from a variety of sensors with different start times and end times. They do not know how to match a meeting event to a space code that never aligned with the floor plan. They do not know how to fix timestamps across different systems that use UTC, local time, seconds, or minutes.
This is why leaders feel annoyed. They ask why a dataset with millions of rows cannot produce one simple view. They ask why insight takes months. They ask why nothing matches. The data landscape inside a building sits in chaos. Many tools claim they solve this. They claim to be the single source of truth. They are not. The most complete picture needs data from many systems. A building produces tens of millions of data points each day. No human can sift through that volume. AI can. But AI needs structured pipelines. Pipelines need shape and alignment.
The Real Work Behind Insight
Strong insight follows a sequence.
- Identify the questions your business wants to answer
- Identify the data sources that hold each signal
- Build pipelines to extract the data at scale
- Clean, normalize, and structure the data
- Align naming, space codes, units, and timestamps across all systems
- Combine pipelines
- Build dashboards
- Use AI to surface patterns no one can see
Most companies rush to create dashboards, then grow frustrated with the lack of flexibility soon after. Some build a data lake and store everything, avoiding integrated pipelines and neglecting data structure. They expect the lake to fix the problem. It never does. Five years later they start again with an external partner. The way to avoid that waste is to understand the data landscape first.
The Scope of Building Data
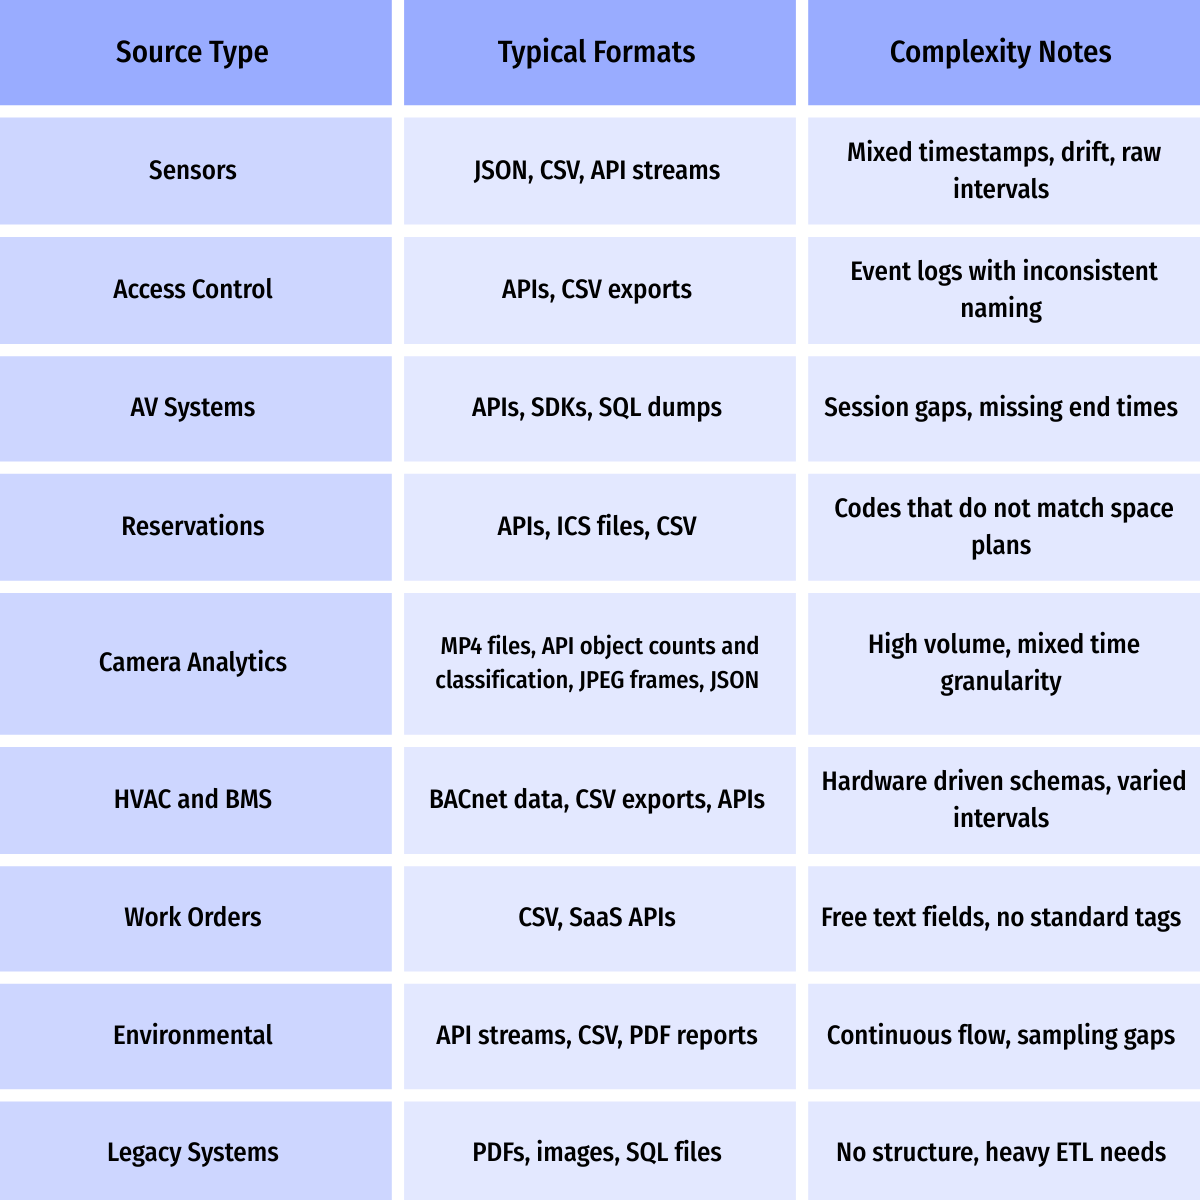
A modern building pushes signals from many systems at once. People create data through badges, reservations, visitors, and A/V logs. Space adds motion signals through sensors and cameras. Building systems add HVAC, lighting, elevator, and access events. Operations add work orders, asset logs, and vendor steps. Environments add CO2, VOC, PM, energy, water leaks, and alarms. Each source uses a different format, timestamp style, unit type, and naming model. Some store timestamps in UTC, while others use local time. Some log data every second or minute, while others only store alerts. Some create structured tables, while others share a variety of file formats like videos, images, and documents. Some create PDFs. Some support APIs or SDKs. Some require customer SQL-like queries to pull data. Some need multiple ETL steps before the data can be understood. Each mismatch slows insight.
Data Map

Source Complexity and Formats
Regulatory Reporting Now Drives New Data Needs
This challenge is no longer just an analytics issue. It is a compliance issue. Cities now push strict reporting rules that demand clean data and accurate insight. New York’s Local Law 97 sets aggressive greenhouse gas limits and requires annual reports that show energy use, emissions, space types, system profiles, and upgrade plans. Chicago, Boston, Denver, Seattle, San Francisco, and Washington DC have similar benchmarking laws that track carbon, energy, electrification progress, and retrofit readiness. Europe moves even faster with mandates tied to ESG, carbon intensity, and building performance ratings.
These rules need strong data pipelines. They need aligned timestamps, consistent units, clean space data, and clear records of how each system performs. They need accurate tracking of HVAC runtime, lighting load, sensor data, energy use, and emissions conversion. Owners must prove data quality. They must show the path to 2030 limits. They must show that upgrades shift load and reduce emissions. Raw logs cannot meet these standards. Siloed systems cannot meet these standards. Manual work cannot meet these standards.
Most owners hire consultants to chase compliance, and while that solves the report, it does not address the root issue. Shifting those consulting dollars into pipelines and structure creates usable data that drives ROI in the first two years, not year five. Regulations will tighten by 2030, and even if the federal landscape shifts, city rules stay firm. Municipal leaders expect accurate tracking and clear progress, and they expect owners to stay ahead of the limits. Strong data gives owners that position.
Why This Mirrors Other Industries
This pattern is not new. Many industries tried to build data solutions in-house before stronger platforms eventually replaced the custom internally built tools.
Early e-commerce shows a clear example. Retailers built their own websites, checkout experiences, payments, and analytics. Those stacks broke under growth. Data sat in silos. Teams could not track buyers or inventory in real time. Then platforms like Shopify created clear pipelines and unified data models. Retailers stopped building from scratch and focused on strategy.
Early CRMs tell the same story. Companies built custom databases to track customers. Fields did not match. Reporting took weeks. Platforms like Salesforce solved it with one model and one structure. Companies stopped building CRMs and focused on growth.
Real estate sits at that same key moment. Data sits scattered. Each signal sits in a different tool. The volume grows each year. The pressure to make decisions grows each quarter. The need for clean pipelines and one model grows each day. Leaders know they cannot hire enough analysts to tame this by hand. They cannot stitch twenty systems into one view. They cannot trust manual work at this scale.
The Path Forward
Savvy handles the full lifecycle of insight. Savvy identifies the right sources. Savvy builds pipelines. Savvy structures the data. Savvy aligns the naming. Savvy merges datasets. Savvy drives AI. Savvy creates clear insight from complex systems.
Most companies try to build this in-house. They learn that real estate analytics needs depth. They learn that insight needs structure. They learn that pipelines matter. Savvy gives leaders a proven path. Savvy turns building complexity into clarity. Savvy gives teams data they can trust. Savvy delivers the insight the field has needed for years.


