

The stakes are high when it comes to space planning decisions in our hybrid, cost-conscious environment. Yet many organizations still rely on outdated methods like clipboard counts and one-time walk-throughs, basing multimillion-dollar construction and renovation investments on broad assumptions and generic benchmarks. These point-in-time snapshots ignore how employees actually use the workplace throughout the day, leading to costly misallocations and underperforming spaces.
With global office utilization targets rising to 79%, space optimization has become so critical to evaluating space needs. CFOs and workplace leaders now scrutinize every square foot, question lease renewals, and demand measurable ROI from workplace investments. Yet, many organizations still make these high-stakes decisions using a fundamentally flawed approach. With so many employees now splitting time between home and office, and between various office locations, legacy metrics and calculations no longer work.
To maximize or to justify your workplace investment, base space‑planning decisions on multi‑dimensional analytics—average utilization alone isn’t enough.
That's why we launched SpacePulse, an innovative service that replaces guesswork in space planning with practical, actionable insights. Harnessing advancements in sensor technology, comprehensive data integrations, and advanced analytics, SpacePulse evaluates behavioral data over weeks, not just a few disparate days. This analysis reveals actual space use at peak demand times, allowing you to optimize future space layouts to better meet your employees' needs and prevent unnecessary construction and wasted investment.
With SpacePulse, you don't have to guess. You know.
We’ve partnered with numerous clients undergoing office moves or major renovations who needed to validate space plans proposed by their designers. These initial recommendations are often built on limited data and short, manual observations. With SpacePulse, we collect high-fidelity behavioral data to validate and refine those assumptions.
The insights we deliver to clients can be surprising and transformative. This enables many workplace teams to confidently recalibrate their meeting space configuration and they saved $18 per square foot on average in buildout costs.
Don't Just Measure Utilization, Capture Behavior
Traditional space planning focuses on averages—square feet per person, weekly room-use percentages—rather than actual behavior. This smoothing hides the crunch periods that matter. In a 3-day in-office policy, overall utilization might show 38% (based on 24 hours) or 23% (based on 40 hours), yet every collaboration space is taken during nine peak hours weekly. Demand is 100% at those moments, exposing a mismatched space mix. Proper planning starts with examining peak-time behavior, ensuring supply never falls short when employees need it most.
Fullness adds another critical dimension. During those same nine peak hours, suppose all 40 rooms are booked, but each is only 50% occupied. That's a seat-mix problem with too many seats per room and too few rooms overall. Overflow meetings spill into open desks, leaving employees huddled at individual workstations on headsets instead of in spaces designed for collaboration.
SpacePulse represents a shift in how space optimization studies are conducted and evaluated. Instead of relying on brief in-person observations or partial AV or conference room data alone, we deploy a more comprehensive approach.
How SpacePulse Works
Integrated Data Sources: During each engagement, relevant data sources are mapped to expose supply–demand ratios, like space utilization, fullness, and occupancy. Reservation logs reveal how often meetings happen ad hoc rather than on the calendar. These behavioral insights guide a more accurate space plan and might show that some teams depend on spontaneous collaboration more than scheduled sessions. Consolidating all feeds into a real-time dashboard yields a comprehensive, multi-source view instead of a single-source snapshot.
Using Savvy, Cohesion's advanced analytics platform, we layer real-time occupancy readings from five complementary data sources:
- Occupancy sensors that count heads, not just binary presence. For short-term studies, we use thermal and cellular sensors that operate on a private cellular network.
- A/V camera analytics as a primary or secondary check on room-level head counts (caveat: camera data quality varies by system).
- Badge-swipe data from access control, tracking overall traffic across the week.
- Room reservations data to compare "intent-to-meet" with actual room use.
- Conference analytics data pinpoints when A/V resources are engaged and reveals the hybrid ratio. For instance, one person occupies a room while seven others join remotely.
This multi-source analysis delivers a far richer view than any single data stream could provide.
Quick Sensor Deployment: To begin the observation period, our team or the sensor company team places occupancy and desk-level sensors across a variety of spaces in just a few hours. These sensors, paired with reservation data, capture comprehensive space usage patterns, including unplanned meetings and informal gatherings. Because the sensors operate on a private cellular network, we can eliminate any perceived network load risk to a client's corporate network. This approach helps to avoid typical delays like procurement or InfoSec reviews. When the observation period concludes, sensor removal is equally swift to minimize disruption to daily operations.
Noise Reduction Approach: Next, we sort through the hundreds of thousands of occupancy observations and cleanses instances where rooms were used for less than 3,5, 7 or even 10 minutes. These thousands of readings can represent brief visits—often facilities pass-throughs, plant watering, or short, unproductive meetings. Removing these events provides a sharper, cleaner view of how each space is used.
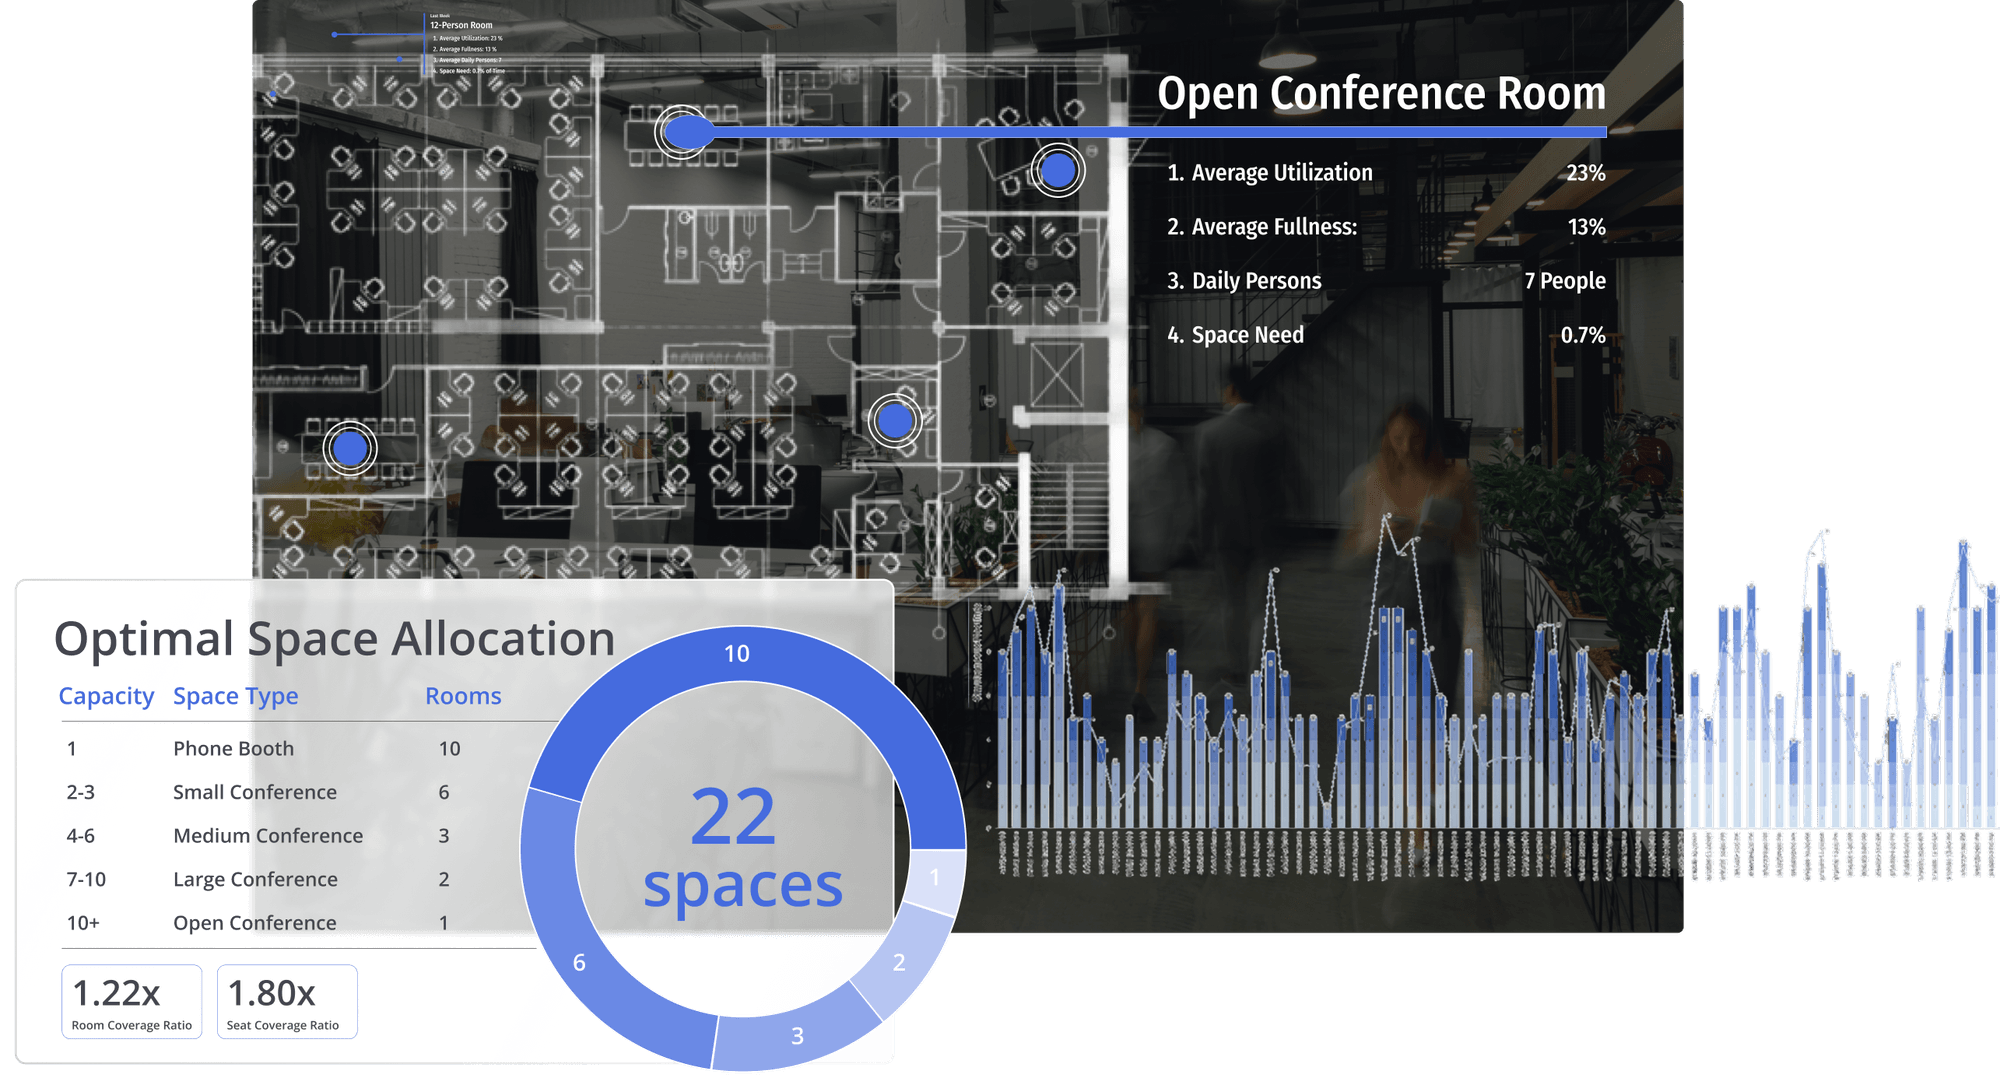
Coverage Ratio Analysis: Our analysis can also evaluate whether a proposed space mix will align with peak demand. By calculating coverage ratios—the supply of seats and the supply of rooms divided by the actual demand—we can determine if there is enough space to meet needs without creating unnecessary excess:
- A coverage ratio above 1.0 indicates that there might be potential oversupply in meeting room inventory and wasted spend.
- A ratio below 1.0 shows a likely risk of undersupply and employee frustration.
The ideal range for the ratio is between 1.0 – 1.5x. This will also be dependent on if you are expecting employee growth or shrinkage. If you are expecting to grow, you should take that coverage ratio into account and aim closer to 1.5x. If you’re shrinking, you may want to be closer to 1.0. Cohesion's analyses provides a data-backed way to right-size space, avoiding costly overbuilding and aligning with employee needs and budgets.
What SpacePulse Reveals
Our approach, driven by integrated behavioral analytics reveals patterns previously not detected through traditional methods. With SpacePulse, we're finding some fascinating data about today's workplace:
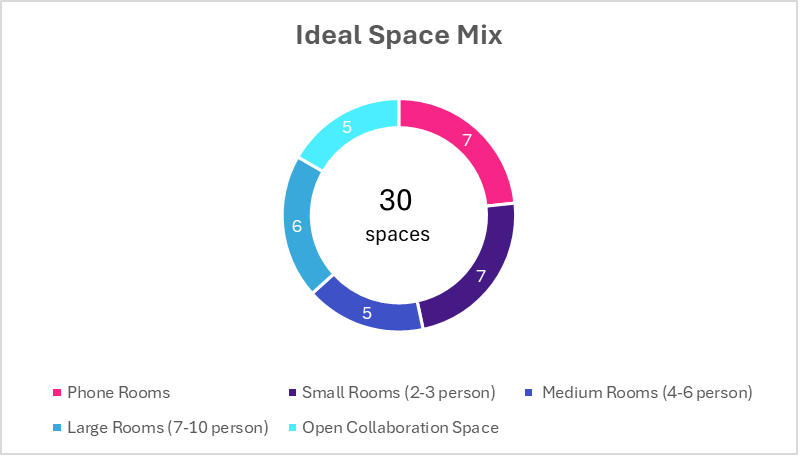
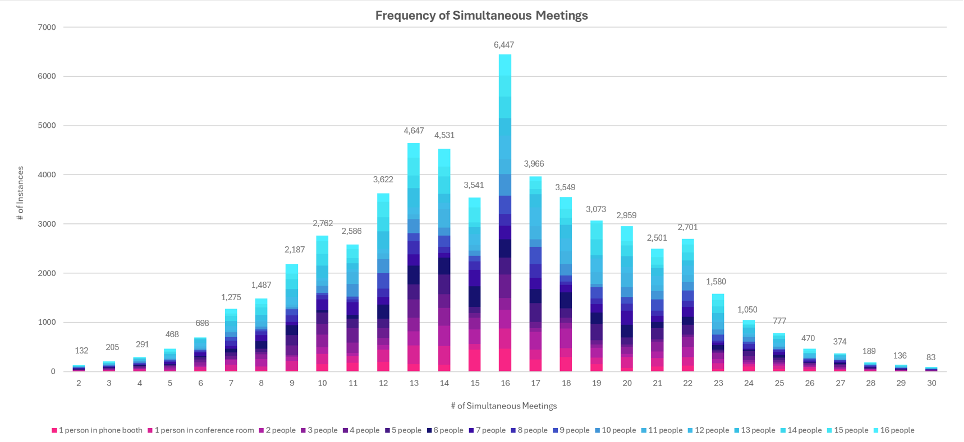
Meeting Size Mismatch: 65% of meetings that happened involved only 1-2 people, while just 15% involved 5 or more people. These findings alone challenge the conventional wisdom of planning for spaces primarily to accommodate larger groups. Many meeting rooms are simply too large for their typical use.
Room Fullness Crisis: Our analysis also shows that meeting rooms for 7-10 people average just 15% fullness. Savvy indicates that these larger, more expensive, premium spaces consistently lacked fullness, representing significant wasted square footage and capital investment on adding seats to rooms.
Rampant Ghost Bookings: 63% of scheduled meeting time goes completely unused. These no-shows represent waste in both space and employee productivity. Rooms that appeared fully booked on calendars sit empty, removing them from the pool of available spaces.
Ad-Hoc Usage Preference: We also see a large percentage of unscheduled room usage showing that employees clearly prefer flexible, "drop-in" collaboration spaces they can use without booking in advance.
Peak Capacity Reality: Even during the busiest times of an observation period, actual space usage often falls far below the available inventory. We observe 34% to 52% occupancy at peak demand, usually about 10% of the total seat capacity. Where booking data and traditional planning can suggest a higher demand, we can calculate a much more accurate (and often lower) utilization ceiling using real-time sensor data.
SpacePulse insights frequently lead clients to overhaul their space plans, unlocking construction and fit out savings of up to $18 per sq ft. By matching room sizes and types to real world collaboration patterns, the revised layouts reduce spending on partitions, seating, furniture, and A/V infrastructure—while simultaneously elevating the employee experience.
Why Guess When You Can Know?
The future of space planning isn't about guessing. It's about knowing. We now have the technology to transform space planning, optimizing utilization, cost, and employee satisfaction.
SpacePulse is a fully managed, tech-enabled service that blends quick sensor deployment, rich data integrations, and behavioral analytics to deliver unmatched analysis – all in just four weeks with no upfront hardware costs.
Ready to find the perfect space mix for your next project? Contact us today or click to learn more about SpacePulse and how we can help you discover how your employees really spend their day, so you can invest in spaces that allow everyone to do their best work.a


